Americans' Intent to Install Solar Panels
My marketing analytics team's project that aimed to understand Americans' intent to install solar panels. We cleaned data, utilized linear and logistic regression, created segments based on attitudinal variables using k-means clustering, and presented our findings to the class.
Background
The Dataset
The dataset for this project is the UT Energy Poll. Now discontinued, the biannual survey run by the Energy Institute at the University of Texas at Austin started in 2011. The dataset contained a sample of 921 respondents designed to be representative of U.S. households.
The Research Question
With that dataset, we asked, “Can Americans’ intention to install solar panels be predicted using attitudes and demographics?”
About the Data
Before we dove into the dataset, we tasked ourselves with first understanding who the data is about. How old are they? How do they identify? How much do they make?
Gender
Here, we can see that roughly 43% of the respondents in the sample identified as female and 57% as male.

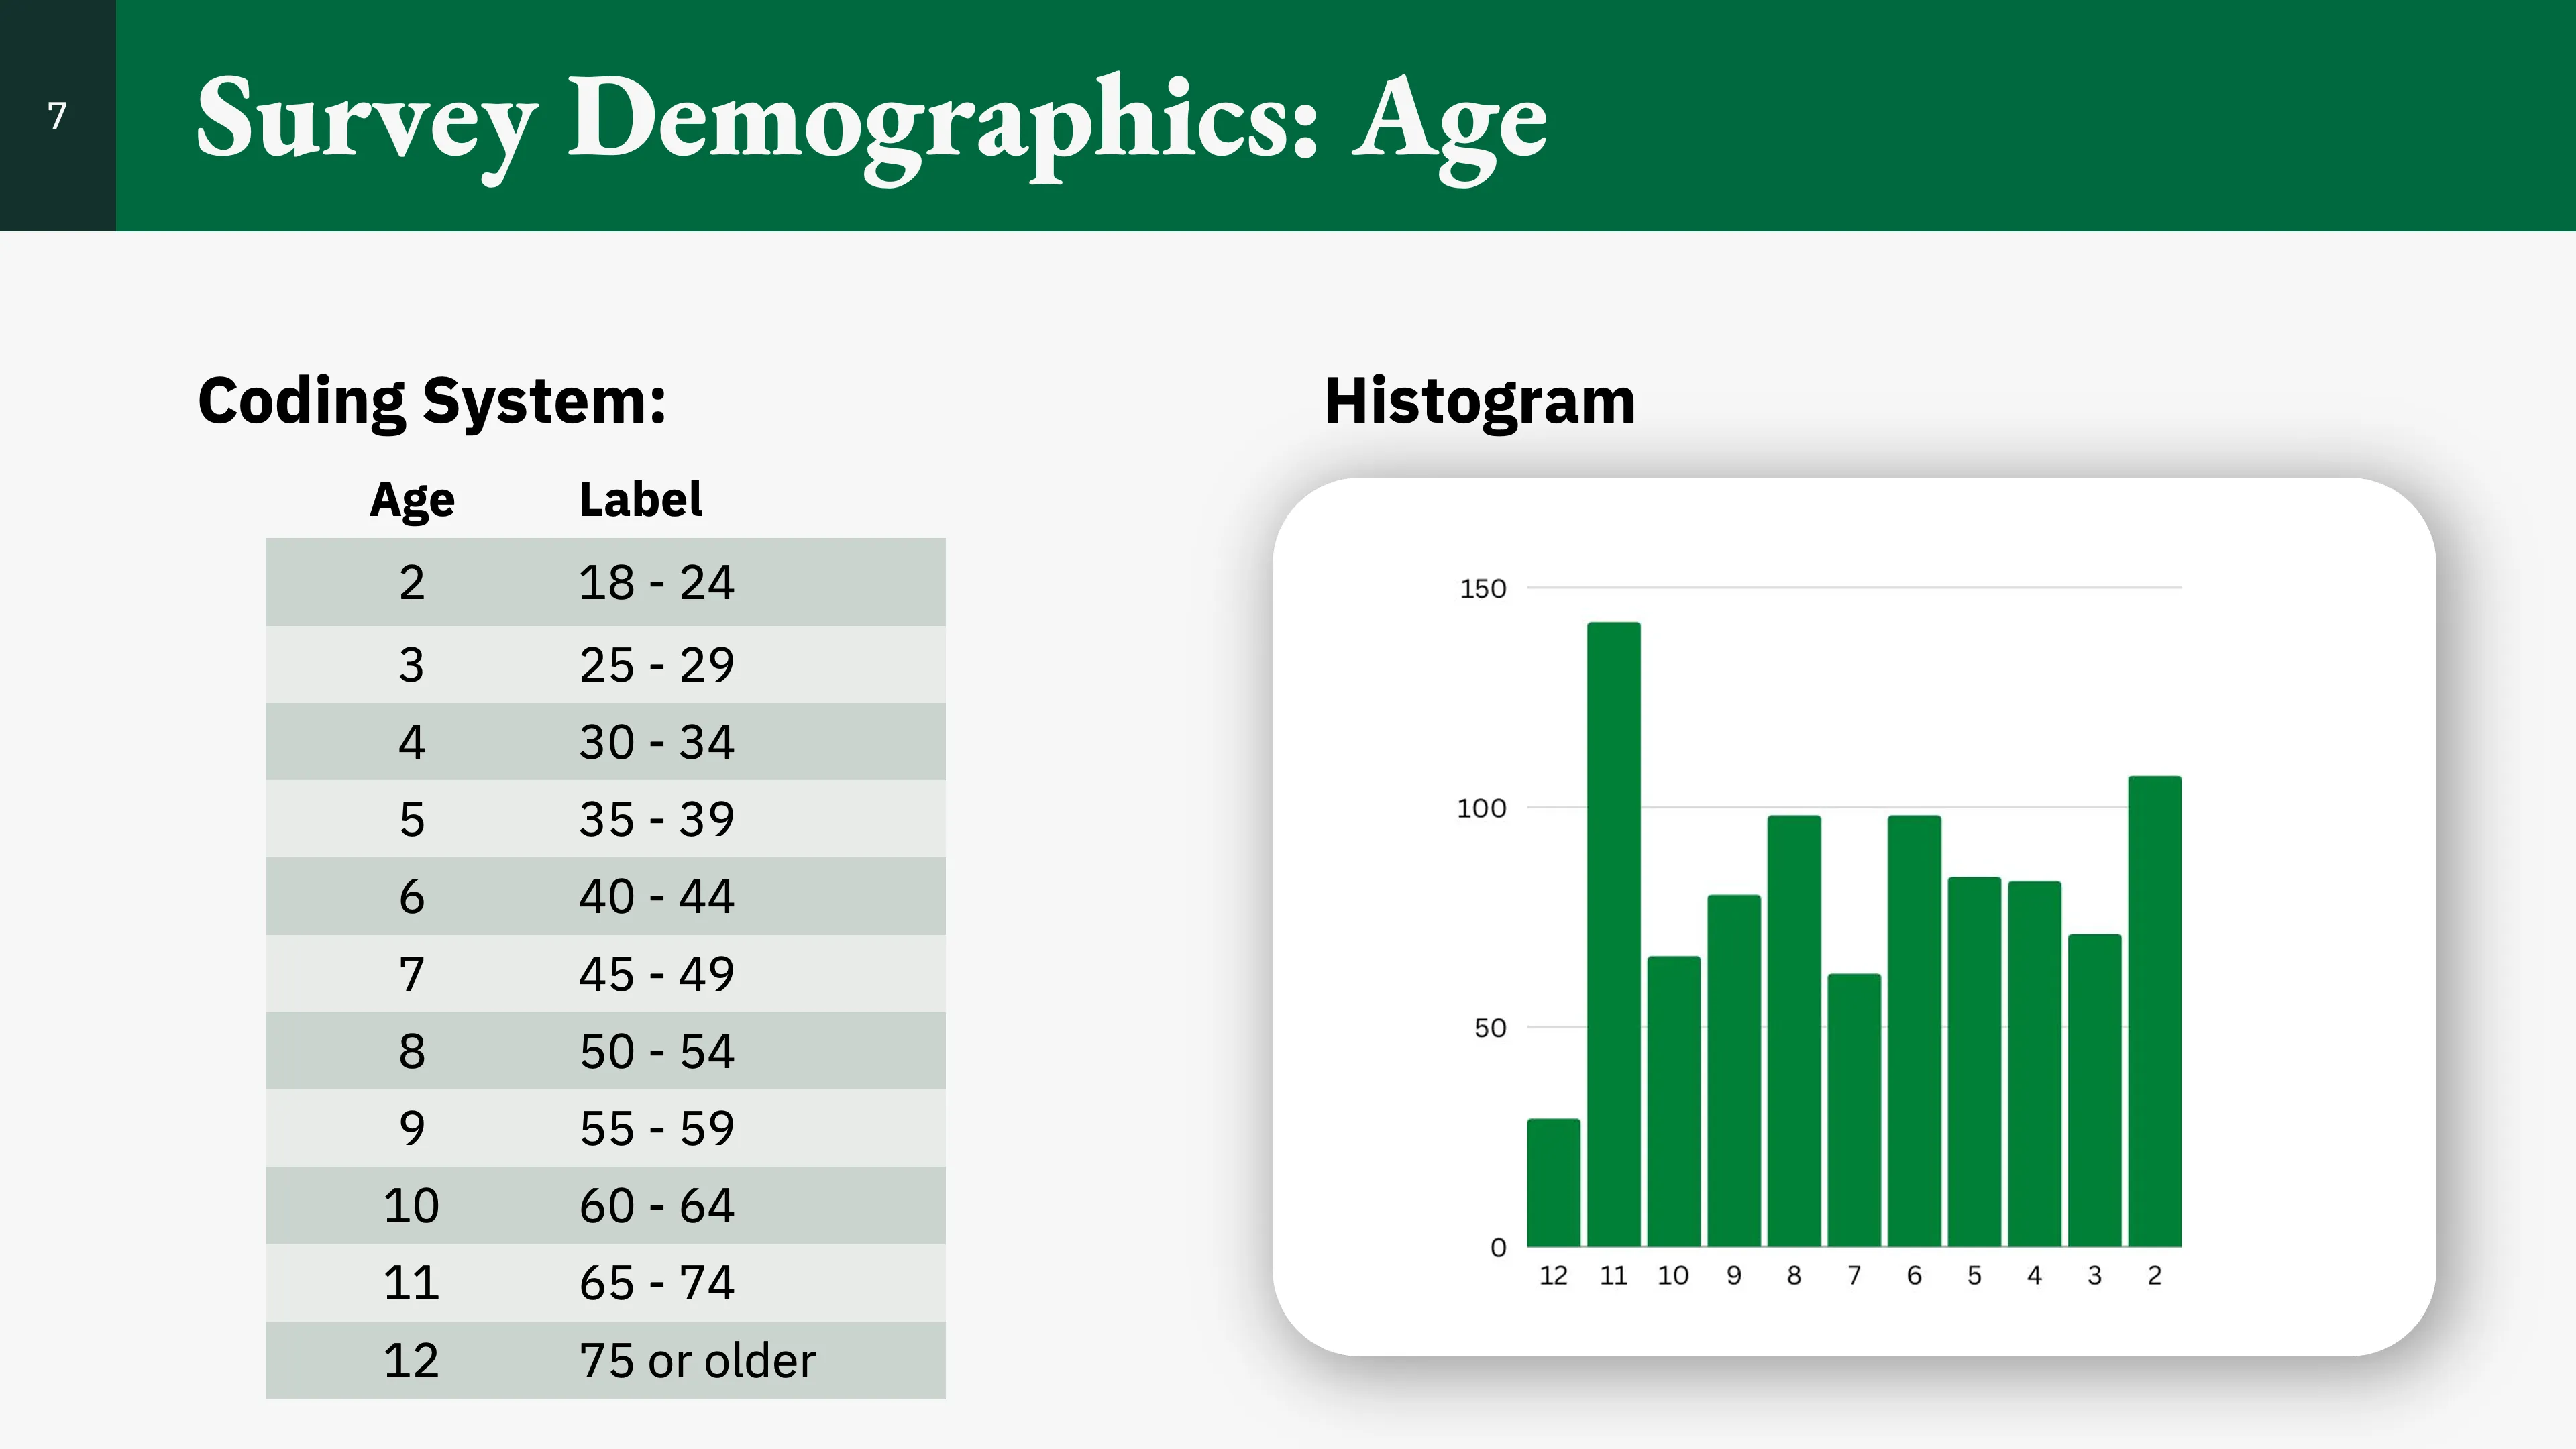
Age
Here, we can see that most respondents were in the 65–74 age range. Following this is the 18–24 age range.
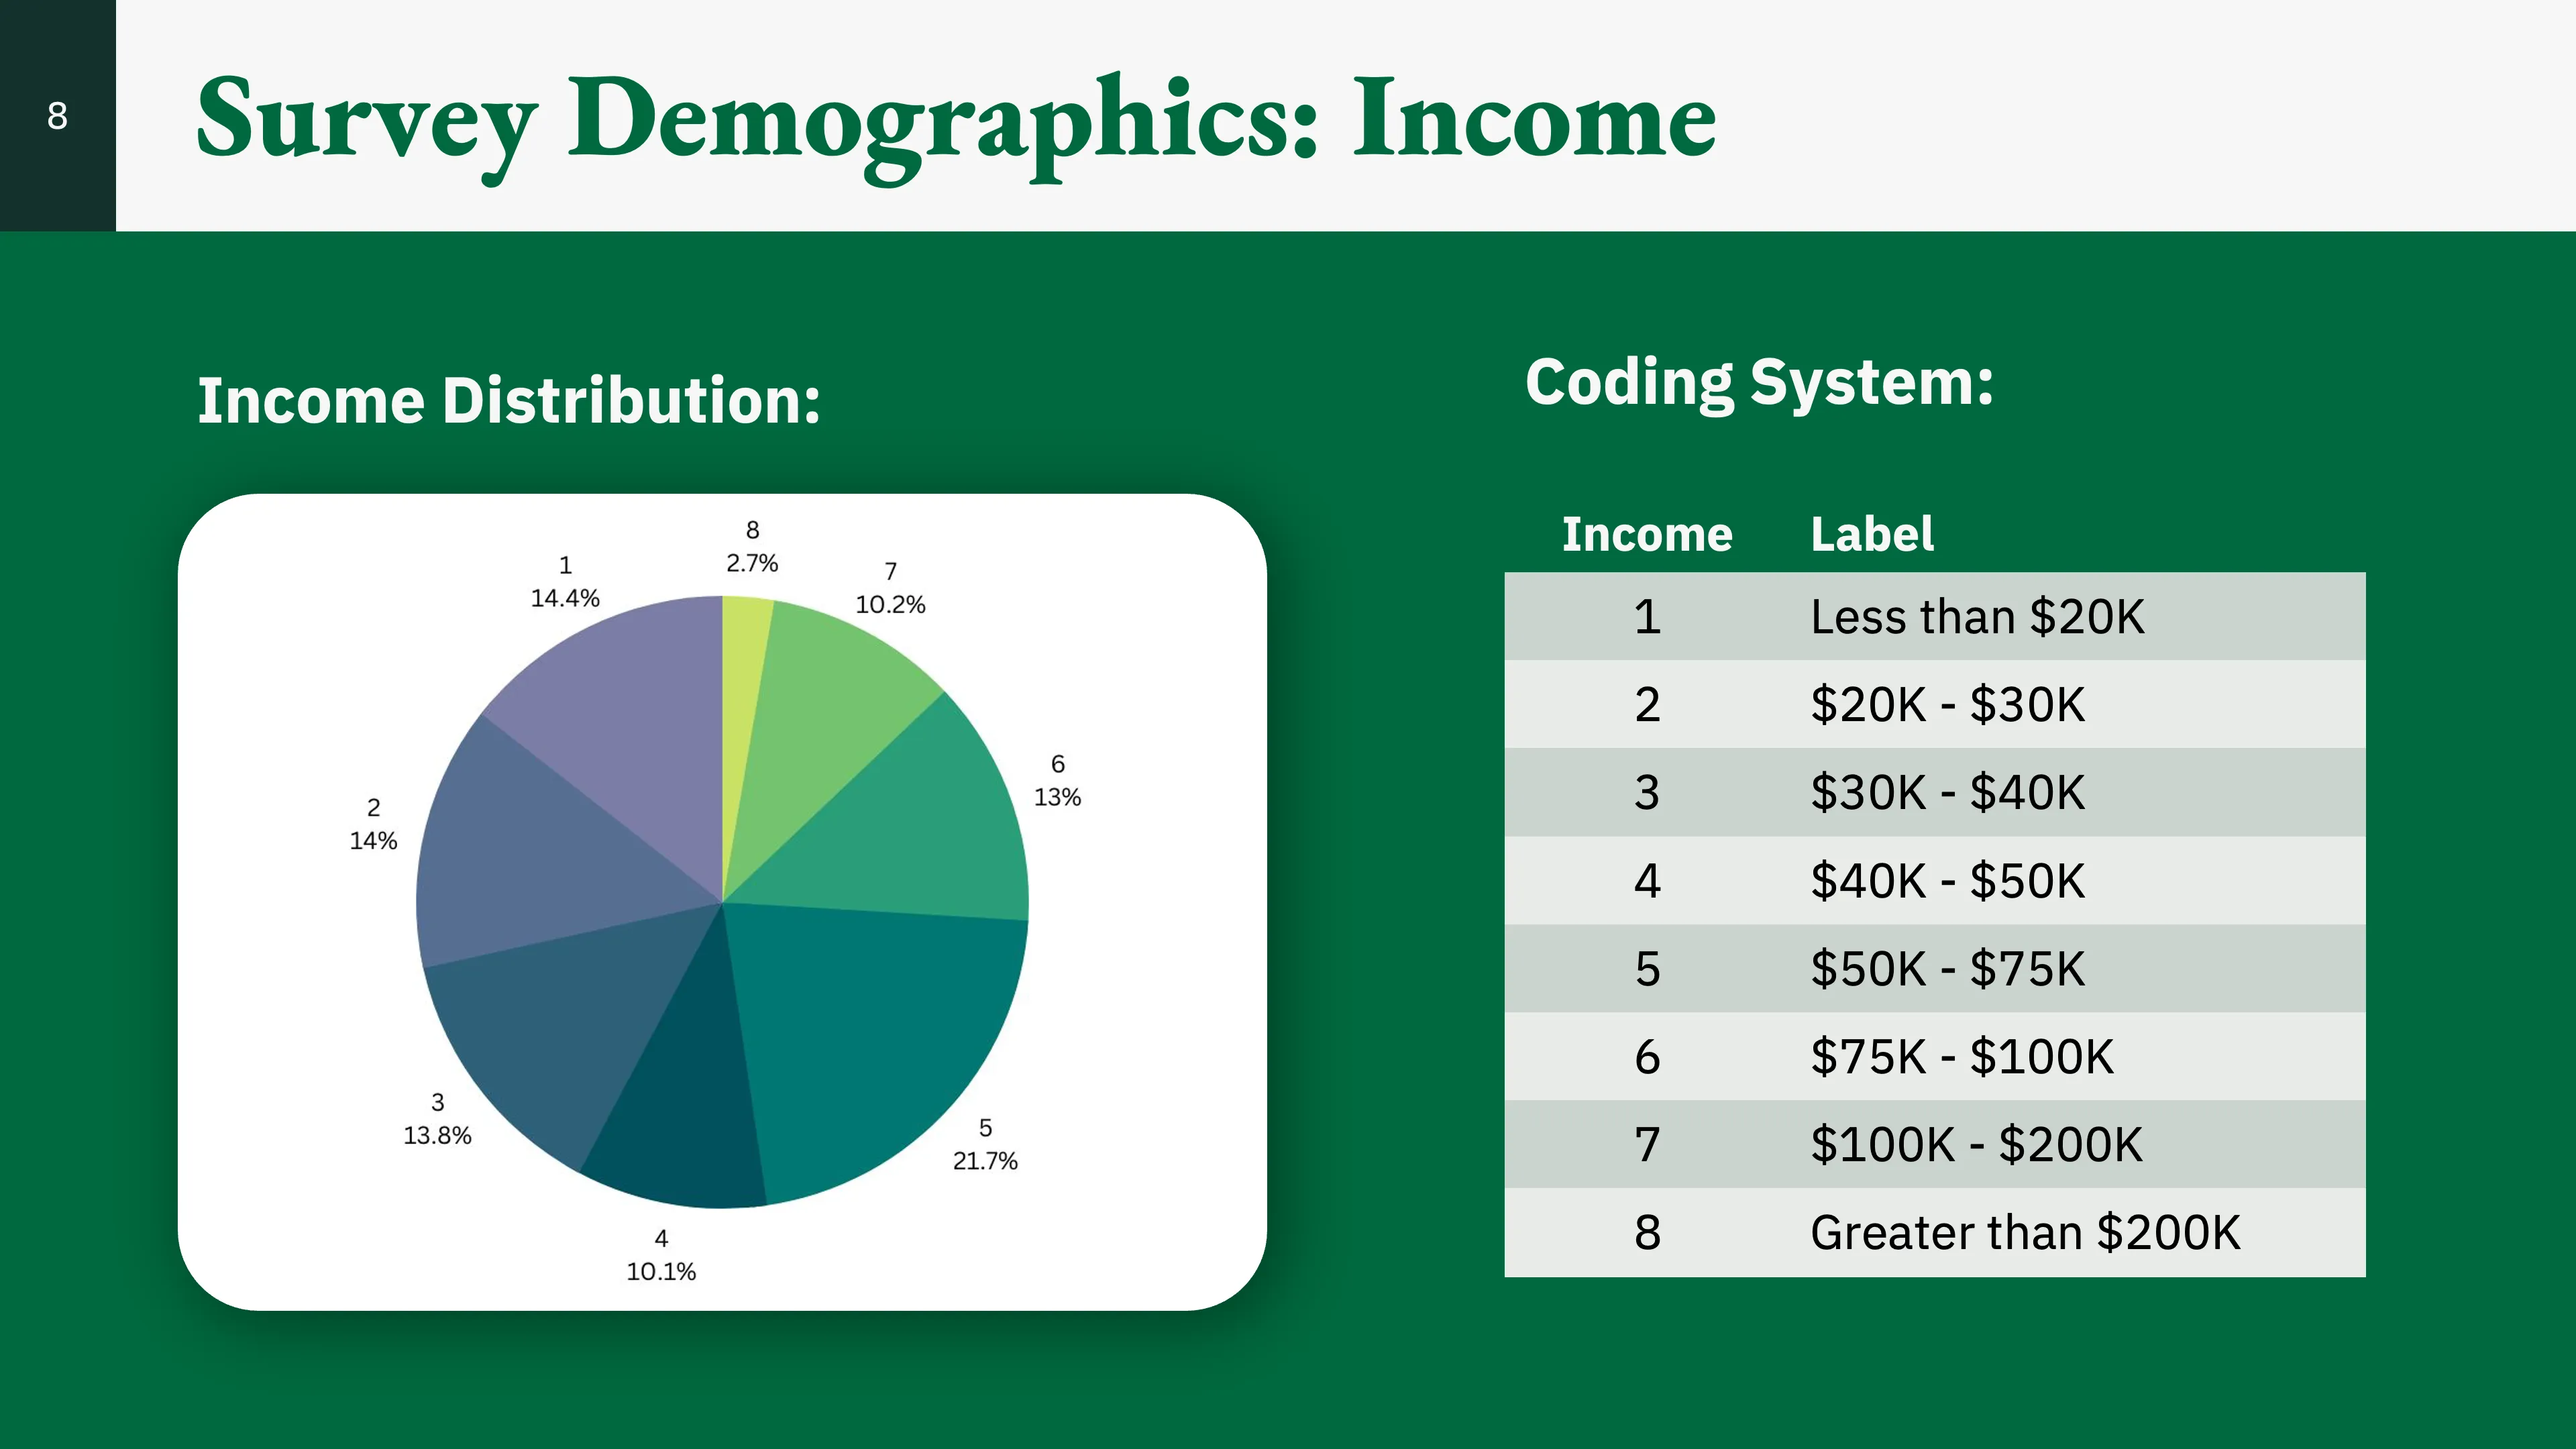
Income
Here, we can see that most respondents had an annual income in the $50K–$75K range.
Example Survey Questions
The following categories of questions pertaining to attitudes were the basis on which we created segments with k-means clustering.
Concern
Please rate how concerned you are about the cost of electricity.
Satisfaction
Please indicate how satisfied you are with the job renewable energy companies are doing to address the energy issues that are most important to you.
Likelihood
Please indicate how likely it is that you will install solar panels at your home within the next 5 years.
Analysis
Variables in Use
| Variable Name | Variable Description |
|---|---|
Q160_8 | Intent to install solar panels from 1 to 7 |
intent_solarPanel | Recoded Q160_8 where all values equal to or above 6 as 1s and below 6 as 0s |
age | Categorical age from 1 to 8 |
gender | Binary gender with 0 being male and 1 being female |
income | Categorical income from 1 to 8 |
age*income | Interaction between age and income |
satisfied_gov_addressEnergyIssues | Mean response of Q110_1, Q110_2, and Q110_3 |
satisfied_ngo_addressEnergyIssues | Mean response of Q110_22, Q110_23, Q110_24, Q110_25, and Q110_26 |
Linear Regression Model
We started with the basics: a linear regression model. Here, we use Q160_8 as the dependent variable. This model provided a poor fit, only explaining about 9.7% of the variance in intent to install solar panels. Notably, age and income were significant predictors though and in alignment with natural assumptions that those who are older or make more money would be more likely display intent to install solar panels.
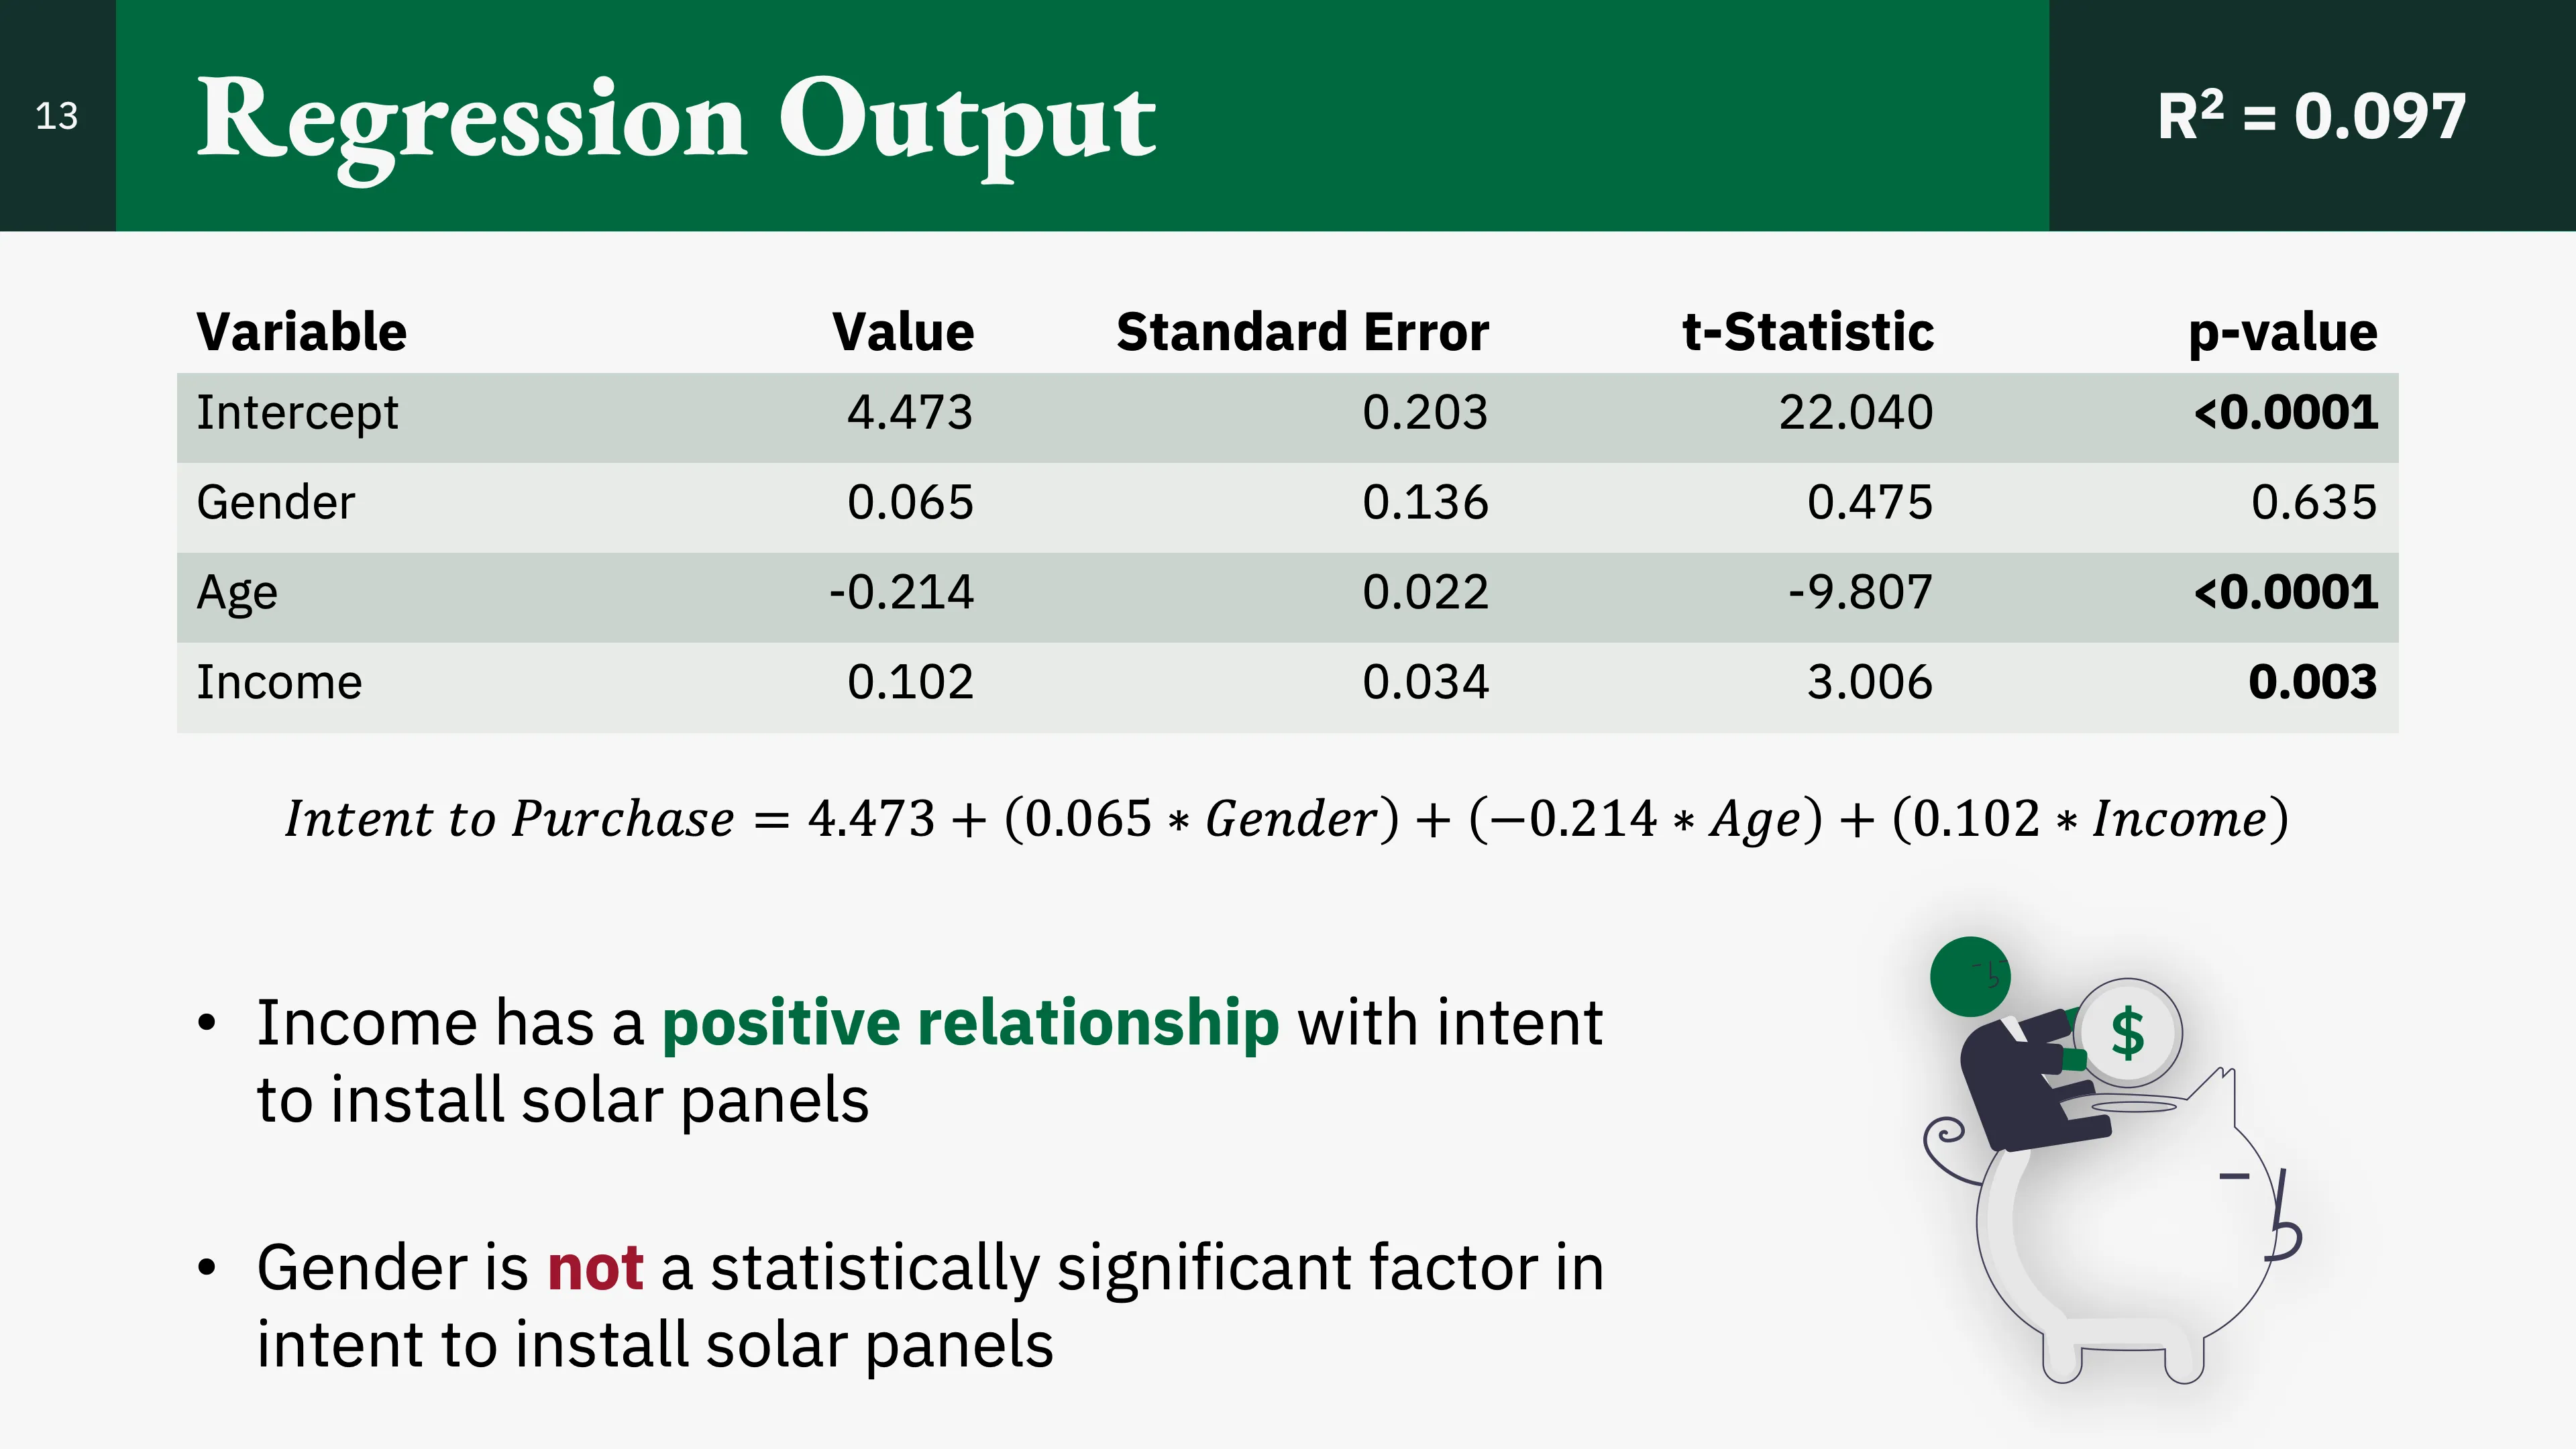
Finding the results of this model to be poor, we moved on to a logistic regression model.
Logistic Regression Model
Before a logistic regression would be possible, we’d need intent to install solar panels to be a binary variable, i.e., a one or zero—in this case, a yes or no. How did we do this?
Top Two Box Score (T2B)
Similar to how Net Promoter Score (NPS) determines promoters and detractors, a top two box score takes the top two responses (six and seven) and summarizes them as displaying intent to install solar panels. Responses with five and below are then categorized as not displaying intent to install solar panels. The picture below illustrates our process of recoding.
Results
Now using our binary variable intent_solarPanel (the transformed Q160_8), we came up with the following model. Additionally, we wanted to capture any interaction between age and income, thus the use of interact_ageIncome.
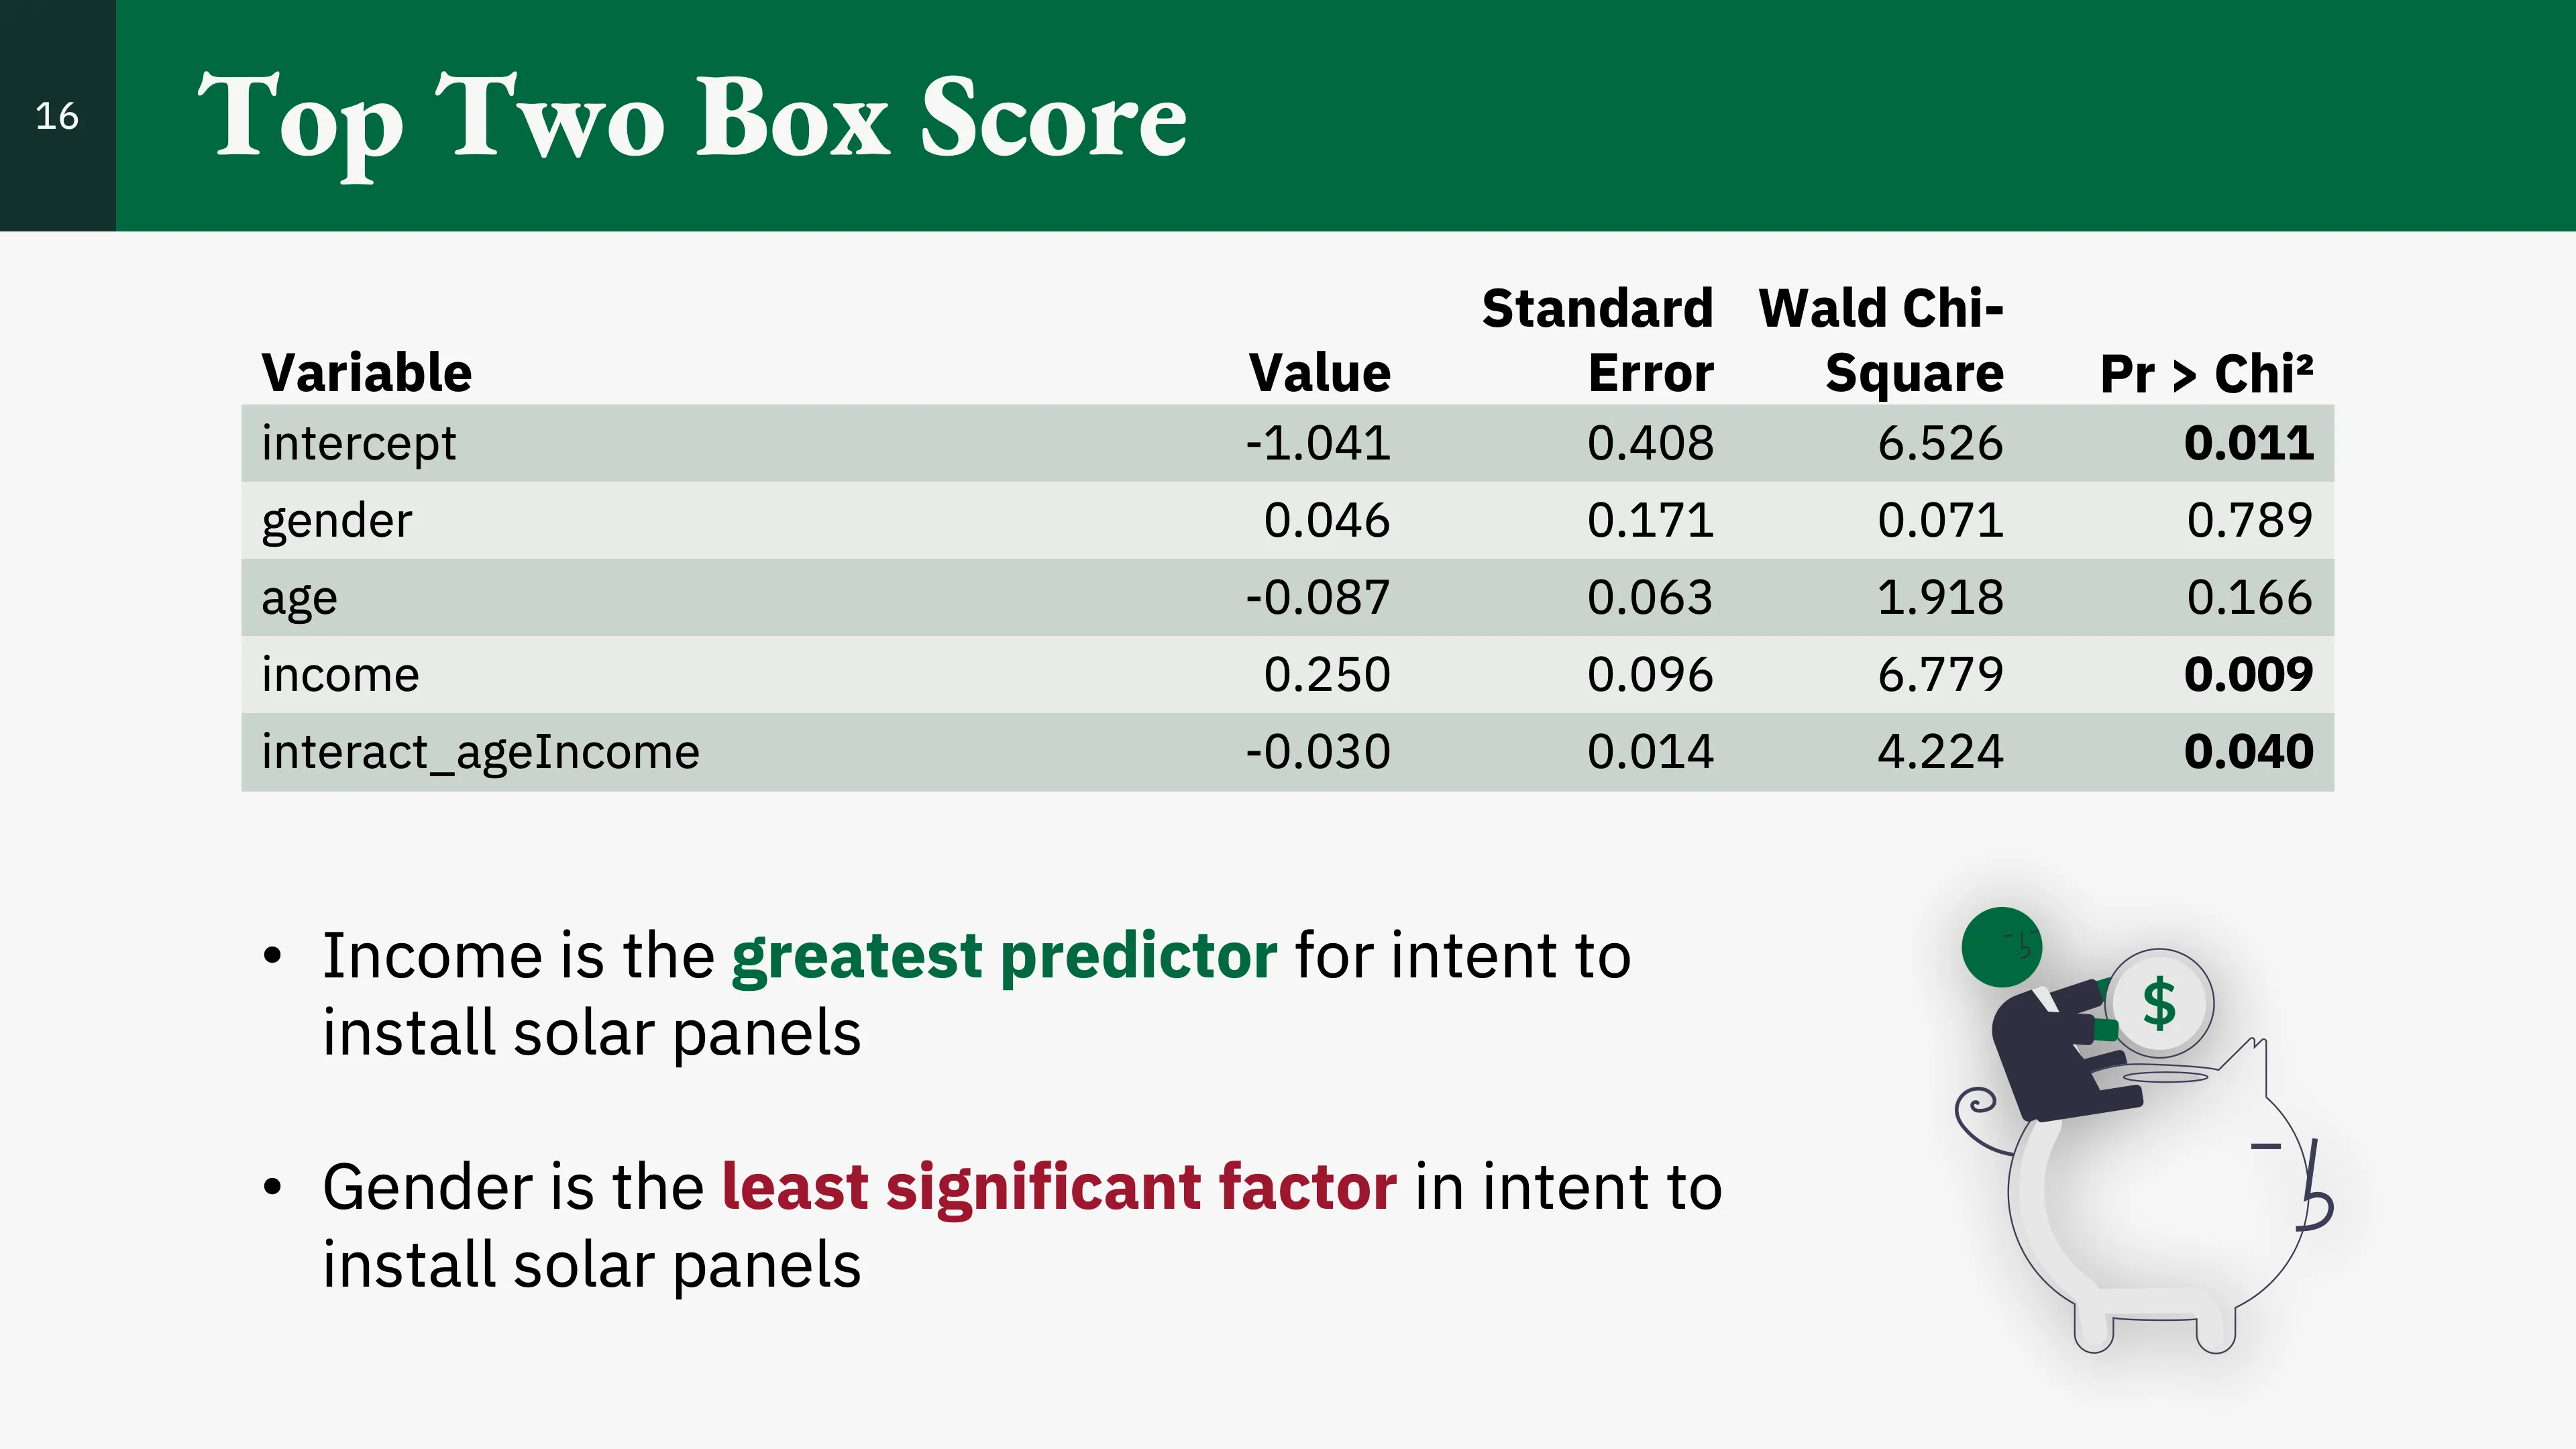
Based on the results, we noticed:
- Gender was still not a significant predictor.
- Age became an insignificant predictor.
- Income is positively associated with intent to solar panels.
- There is a negative interaction term between age and income.
Regarding the negative interaction term (interact_ageIncome), this suggests a diminishing effect for income, implying that for two equal increases in income, the impact on the intent to install solar panels will, on average, be higher for a younger respondent.
But we weren’t satisfied just yet, so we moved on to k-means clustering.
K-Means Clustering
Incorporating Attitudinal Variables
Before we could cluster, we needed to incorporate the attitudinal variables to ensure that we can make a meaningful comparison between the regression model/models before and after clustering.
The two variables we added were the satisfaction with how environmental NGOs and also the government are addressing energy issues—(satisfied_ngo_addressEnergyIssues) and (satisfied_gov_addressEnergyIssues), respectively.
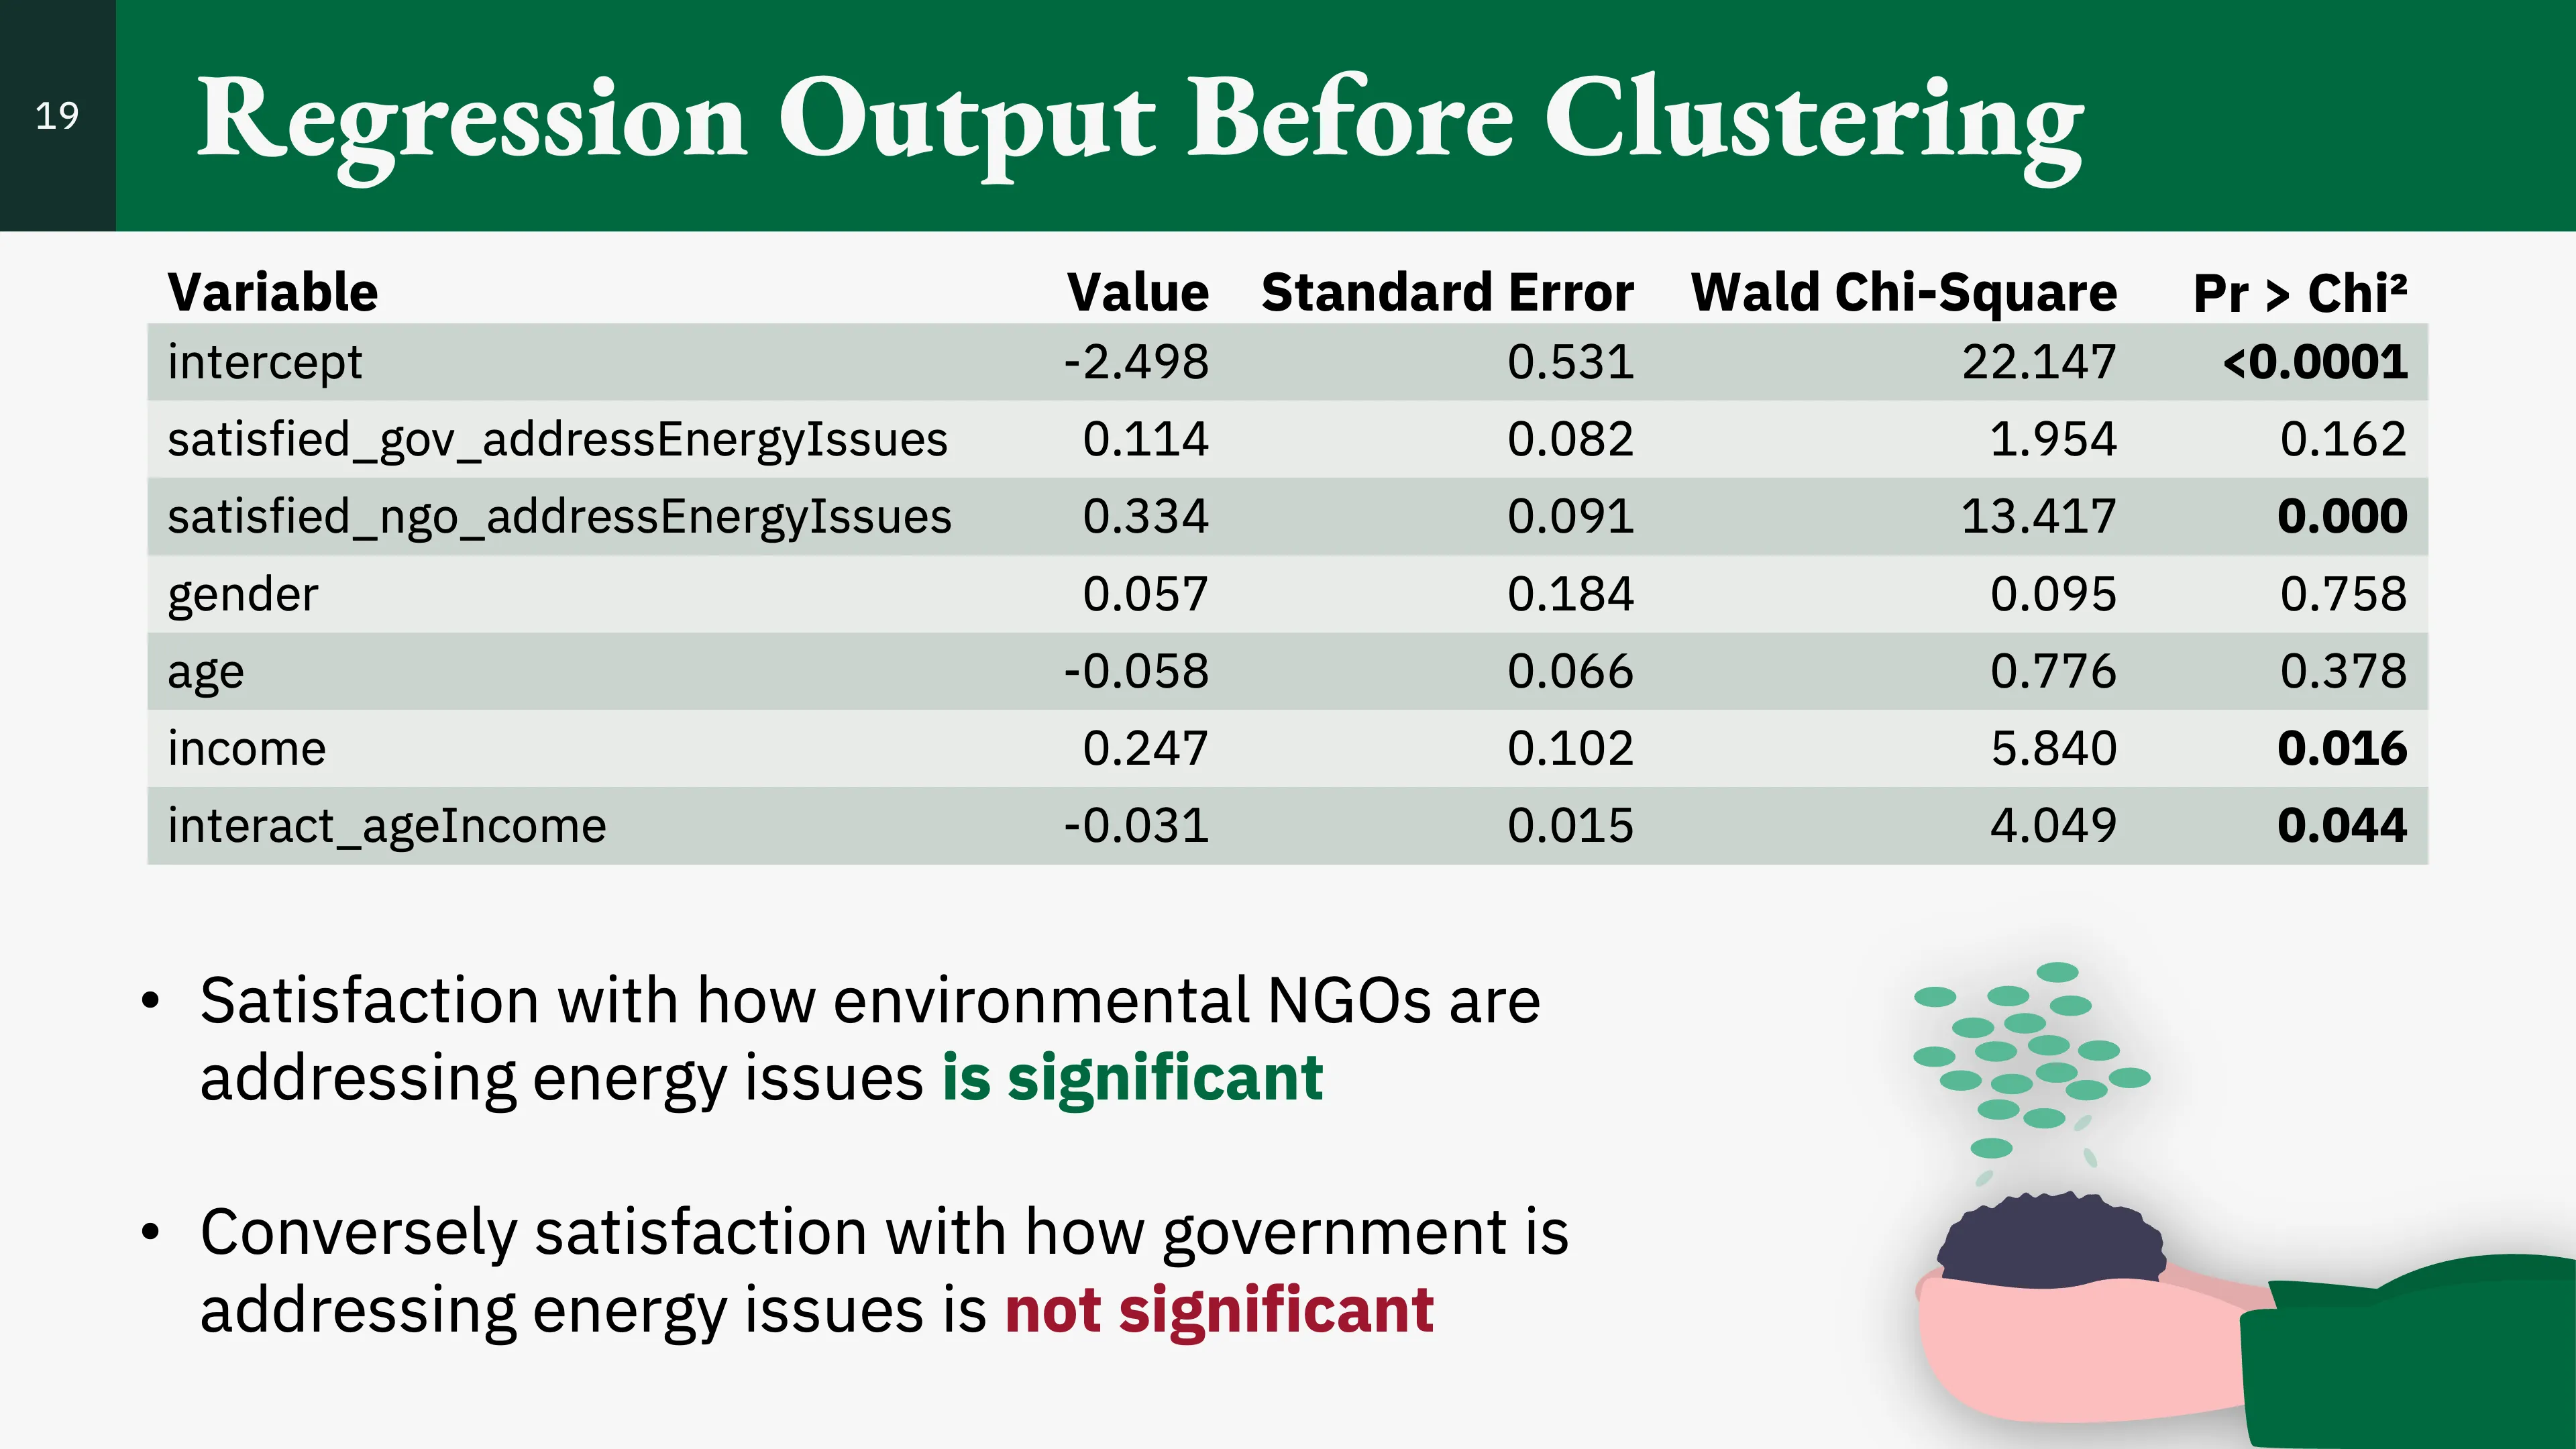
We added these variables to the model and found:
- Both income and the interaction between age and income remained significant.
- Both income and the interaction between age and income’s magnitude remained nearly the same.
- That satisfaction with how the government is addressing energy issues is not significant.
- That satisfaction with how environmental NGOs are addressing energy issues is significant and is positively associated with intention to install solar panels.
Clustering
We then used k-means clustering to segment the respondents based on the attitudinal variables.
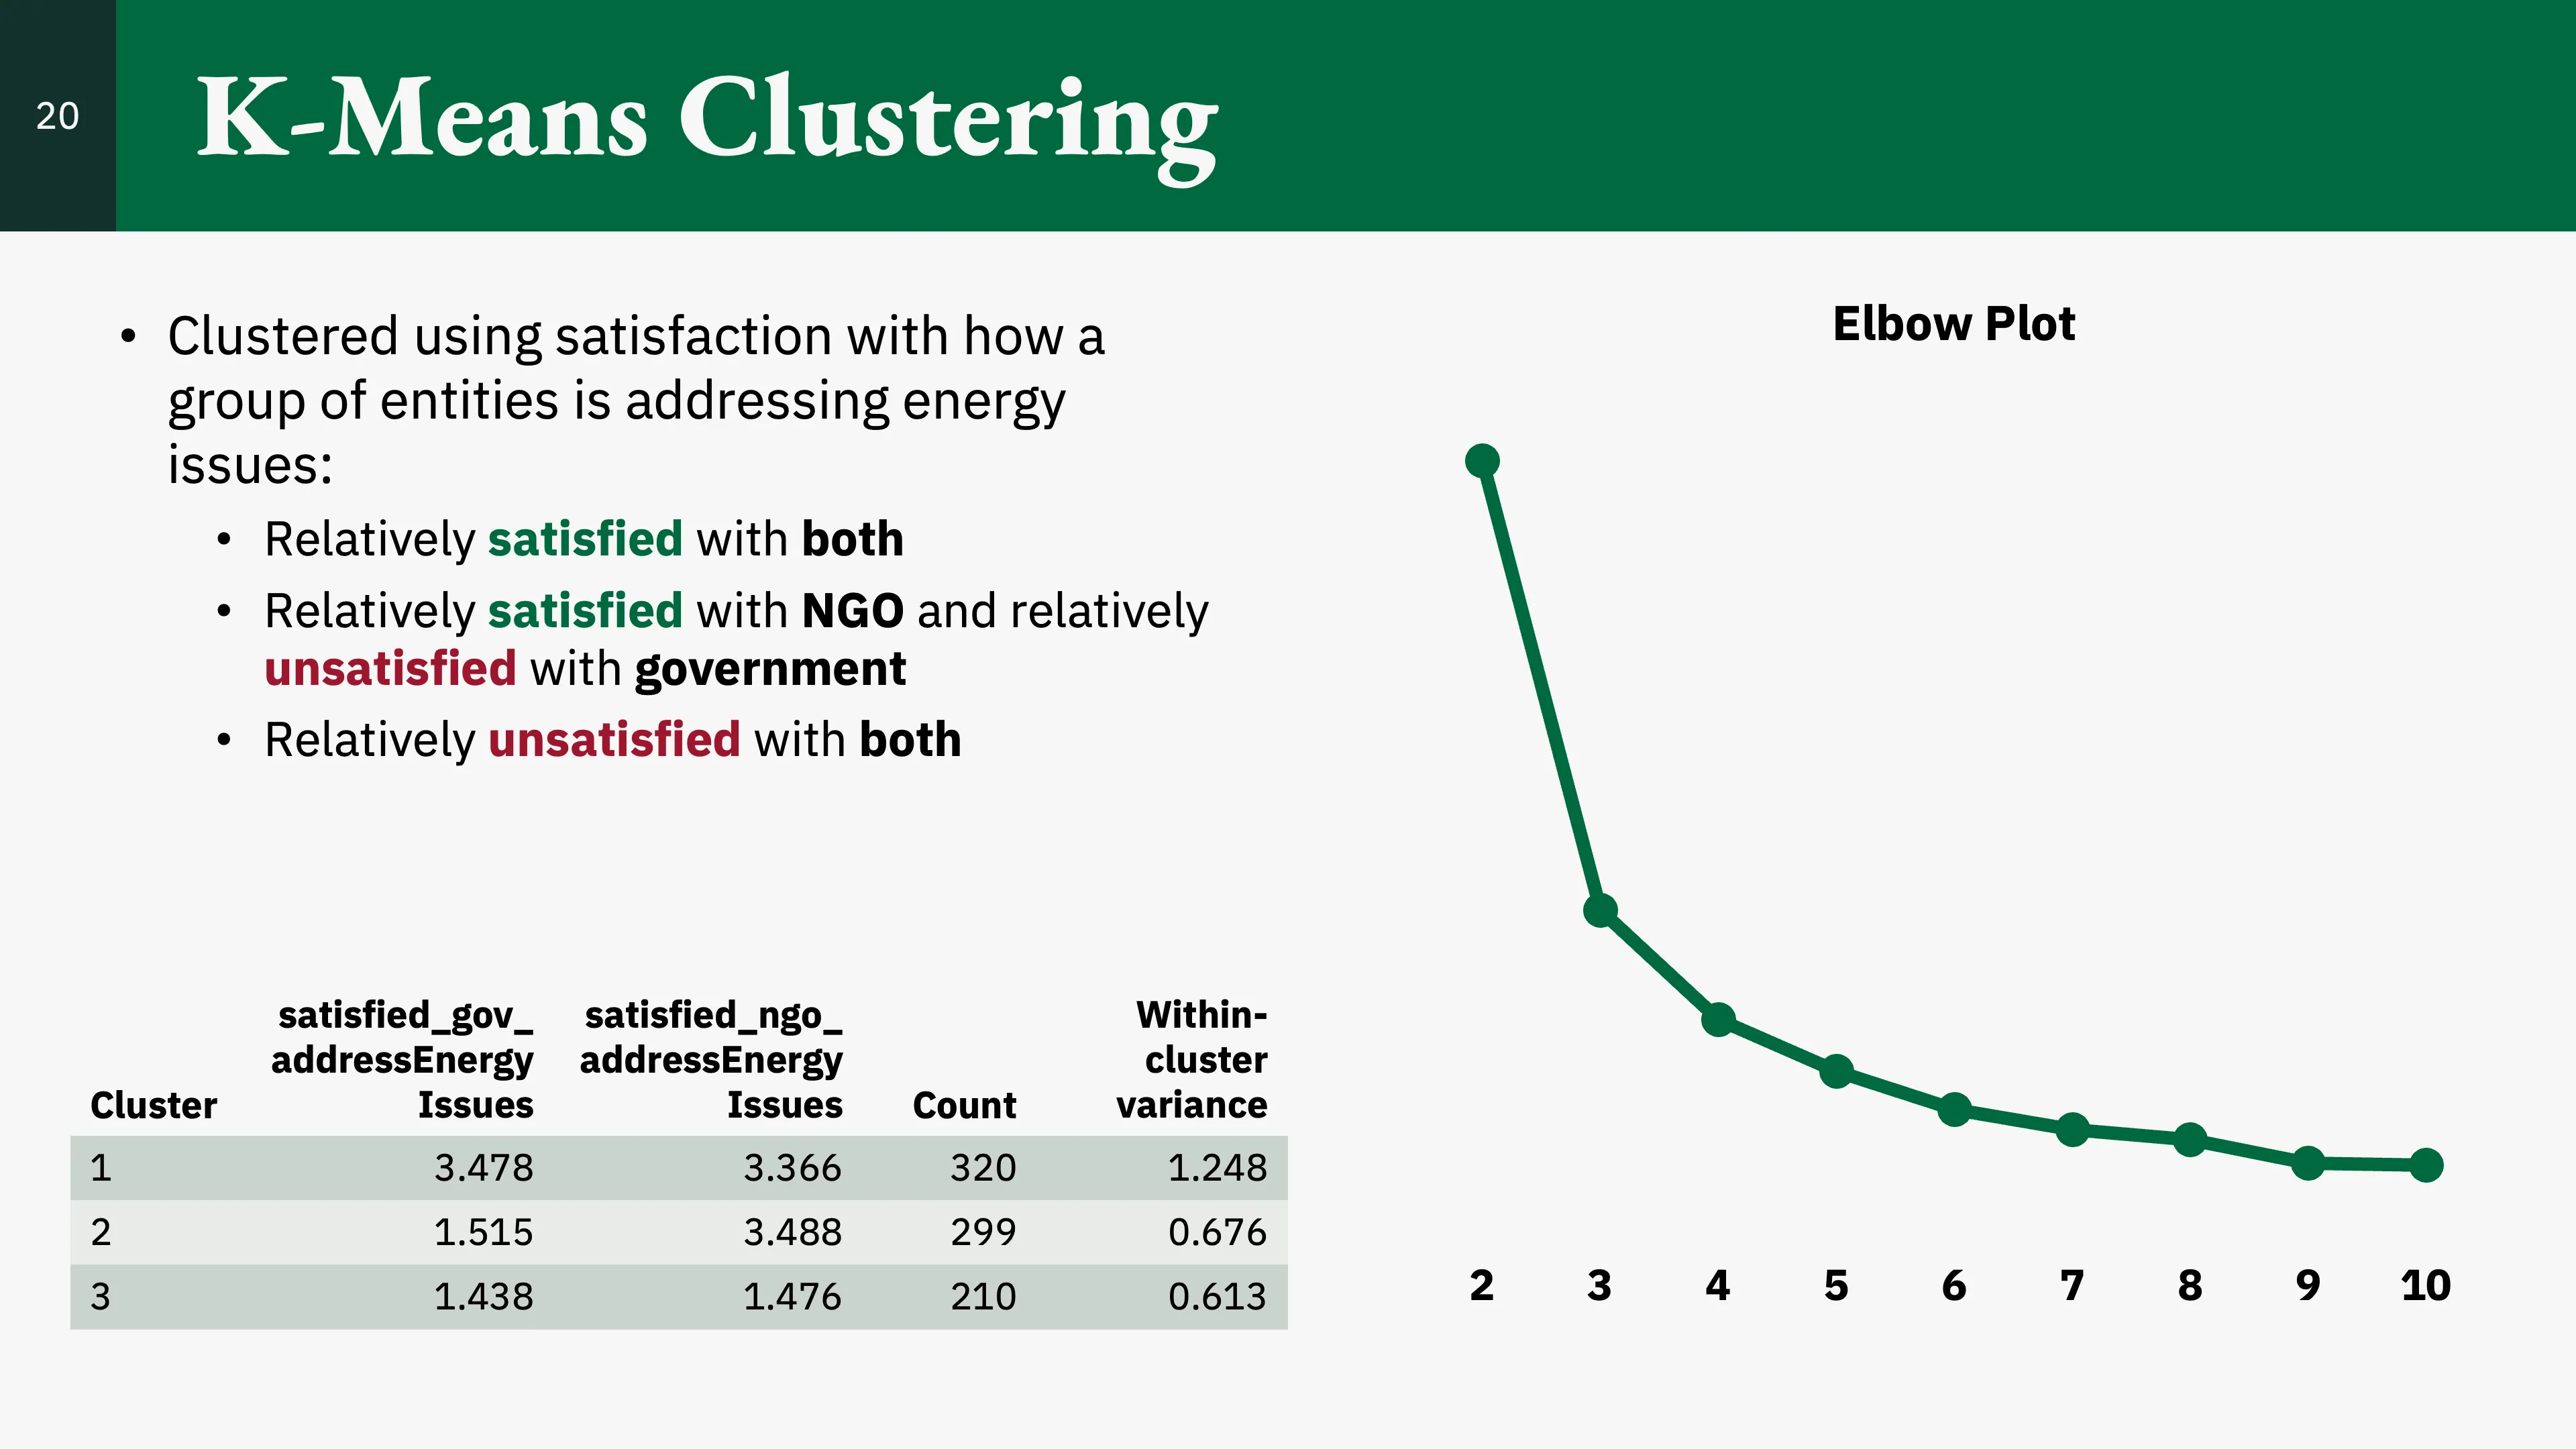
We found that the optimal number of clusters was three. The clusters were as follows:
- Cluster 1: Relatively low satisfaction with both government and environmental NGOs addressing energy issues.
- Cluster 2: Relatively high satisfaction with both government and environmental NGOs addressing energy issues.
- Cluster 3: Relatively high satisfaction with environmental NGOs addressing energy issues and relatively low satisfaction with government addressing energy issues.
Results
After deciding on three clusters, we then ran a logistic regression model for each cluster.
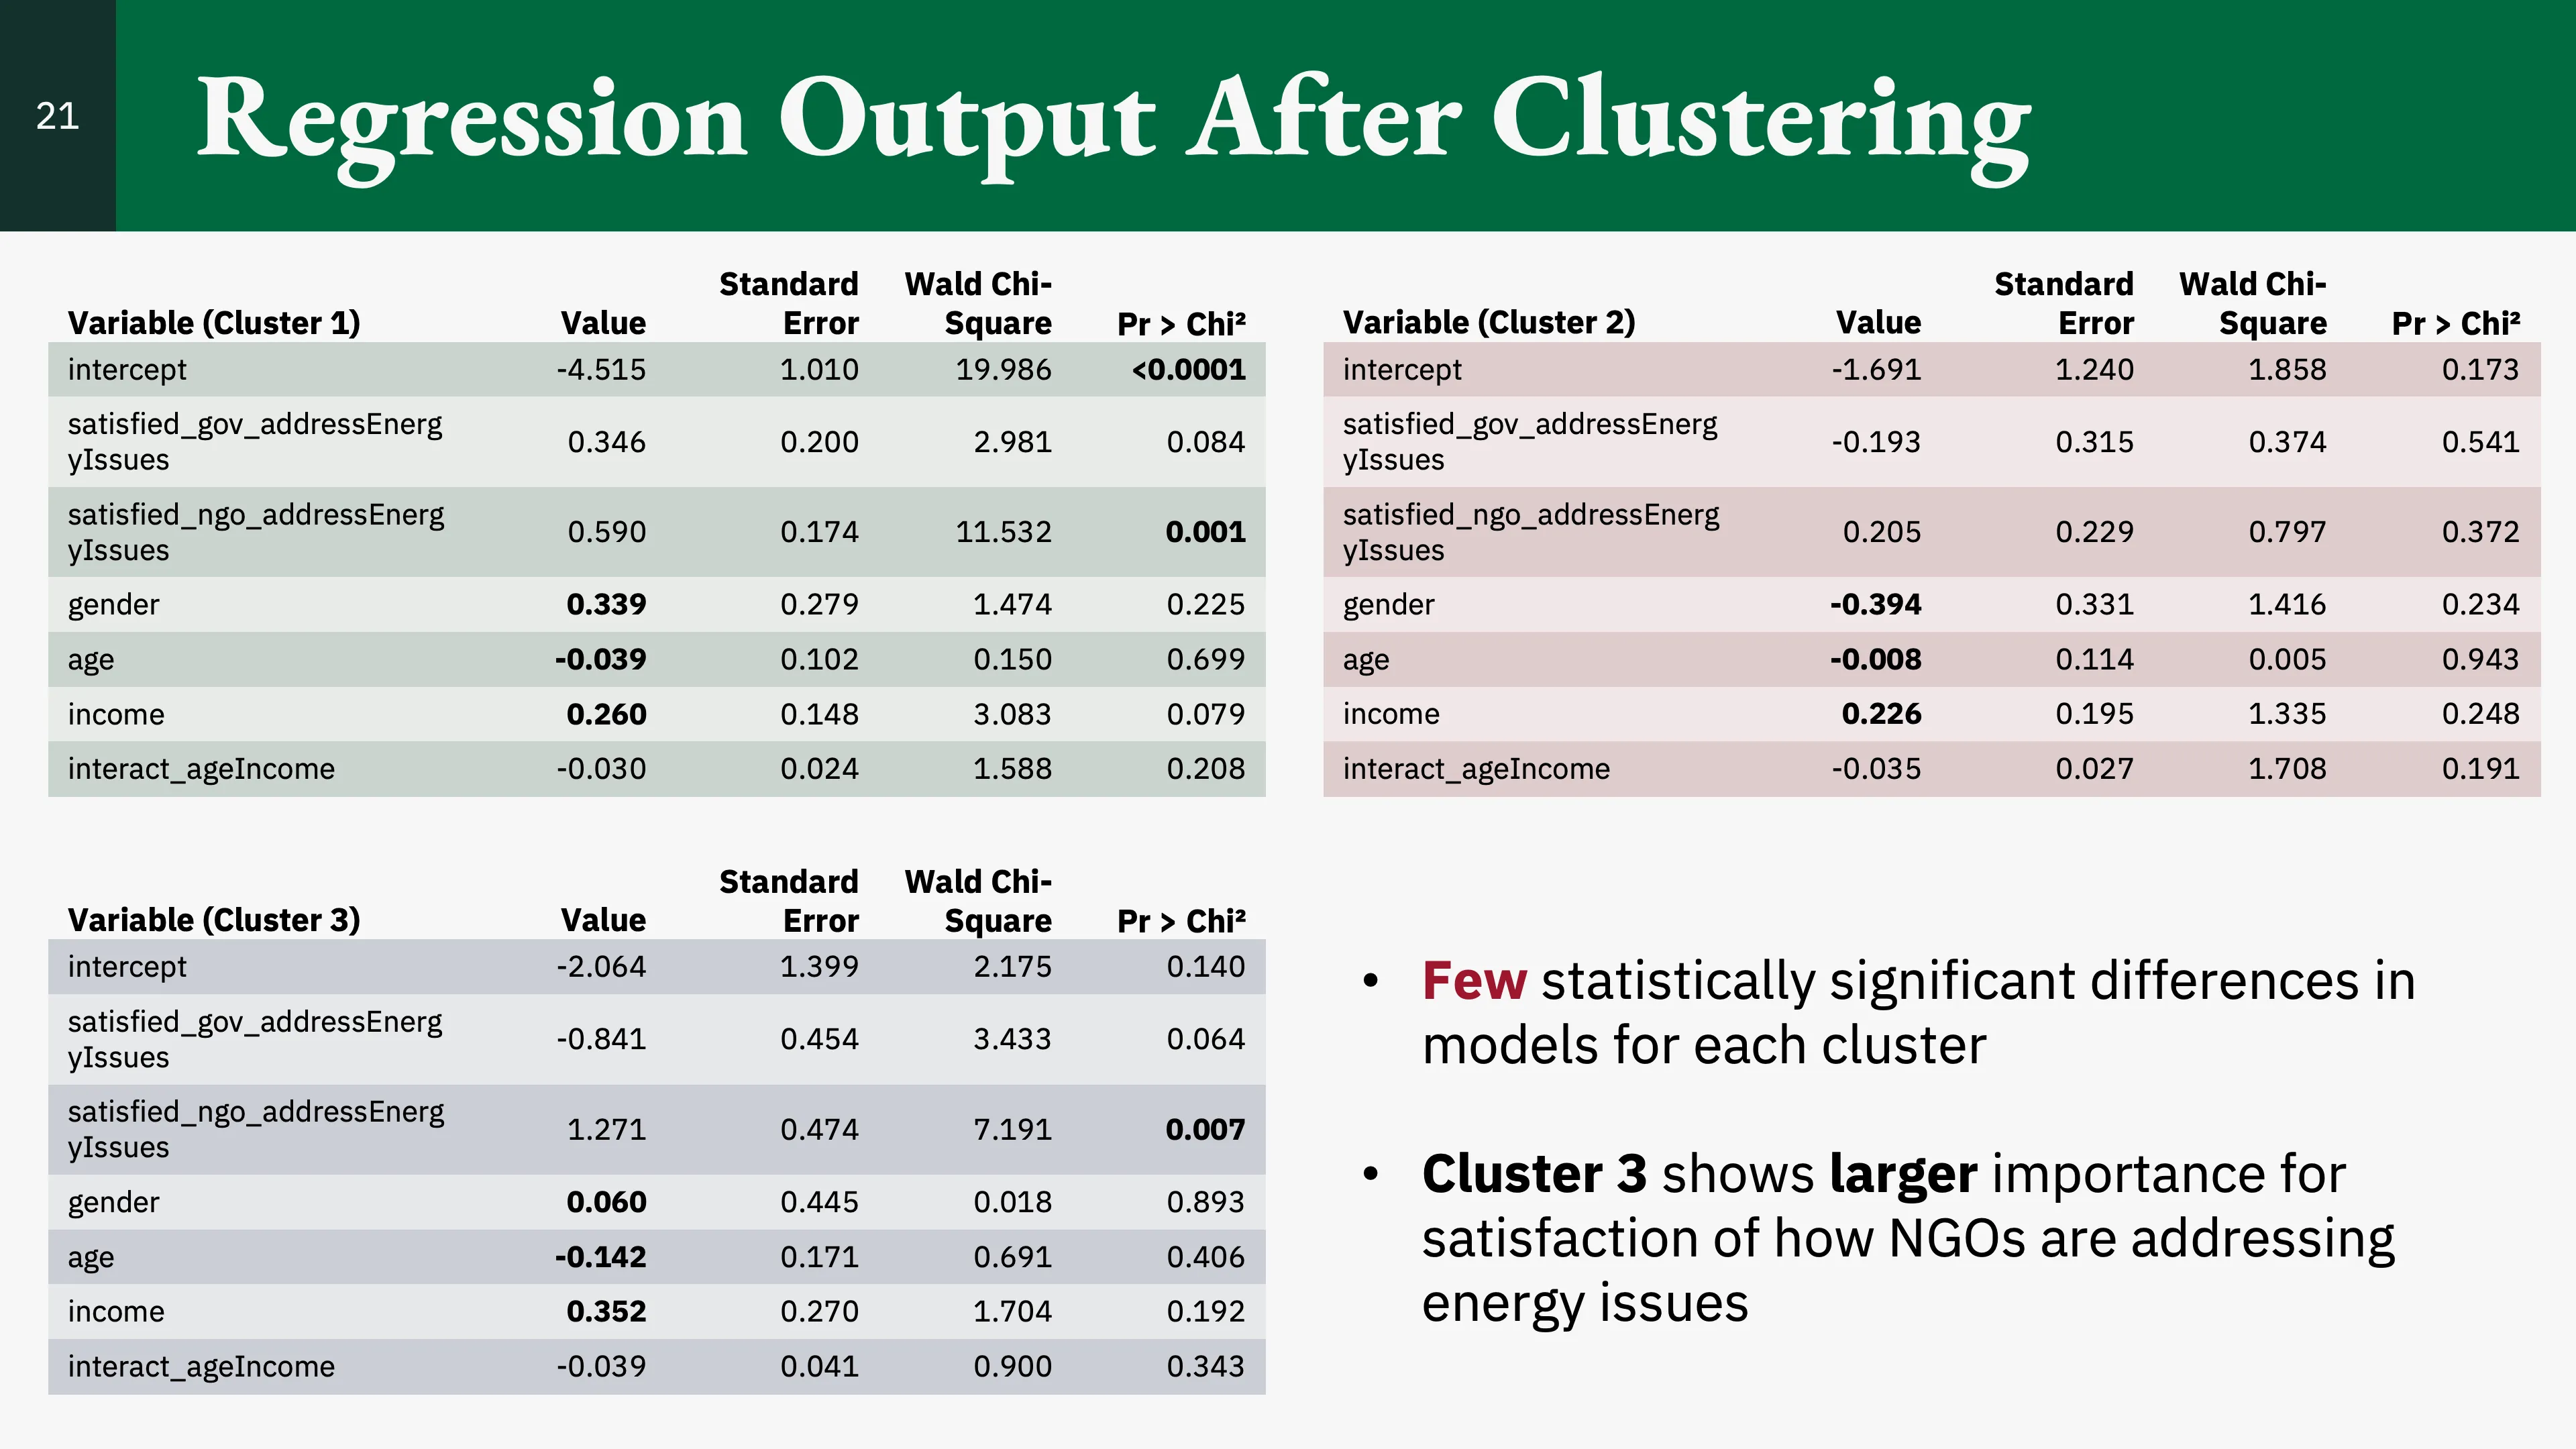
We found that there were few statistically significant differences between the clusters, and overall, clustering provided little in the way of meaningful results.
Conclusion
Answering the Research Question
We found that some demographics (e.g., income) may predict Americans’ intent to install solar panels better than attitudes, though attitudes are not perfect predictors of intent. We also found that clustering based on attitudes did not provide meaningful results.
Thus, the best model to predict Americans’ intent to install solar panels was the logistic regression model that incorporated attitudinal variables.
Using the Model

Based on our findings, we suggested that if the cost of acquiring a customer is low, then this model may be worth using and carries little risk. However, if the cost is high, then the model may not be worth using, as it carries a high risk.